
Filming is currently underway on a special online course based on this blog which will include videos, animations and work-throughs to illustrate, in a visual way, how the Fourier Transform works, what all the maths is all about and how it is applied in the real world.
Click here to reserve your free module
The module will be emailed to you the moment the course goes live.
What is Sound?
I said in the previous blog post that I cannot promise to not use any maths at all in the course of these blog posts (at the end of the day, the Fourier Transform is a mathematical formula) but every equation will be illustrated by diagrams and animations to explain how and what the maths is doing and how it affects the real world.
So here’s our first bit of maths. The equation for the Fourier Transform itself. Don’t worry! It’s going to look like gibberish, but hopefully by the end of this series of blog posts you’ll be able to understand what the formula actually means.

In order to understand what the Fourier Transform does to our sound signal, I first want to define what sound actually is and look at how it is made. This is important as the Fourier Transform works by making an assumption about sound and I want to try and demonstrate that this assumption is a pretty accurate one.
Sound is made when an object vibrates. The object in question could be a violin string, a speaker cone, human vocal chords or even a ruler flicked on a desk.
As the object vibrates back and forth, it pushes and pulls the air molecules around it. As the air molecules are pushed together, they bunch up causing regions of high pressure. As they are pulled apart they spread out again creating regions of low pressure. These regions of high and low pressure, air molecules bunching up together then moving apart again, in turn knock other air molecules which in turn knock into even more air molecules causing a wave like effect which travels away from the vibrating object. This is what we call a sound wave.
This effect can actually be seen by a special photographic method known as Schlieren Photography which shows us the sound wave as it travels through the air. You can see it happening in the following image filmed by Drs. Michael Hargather and Gary Settles at Penn State University.
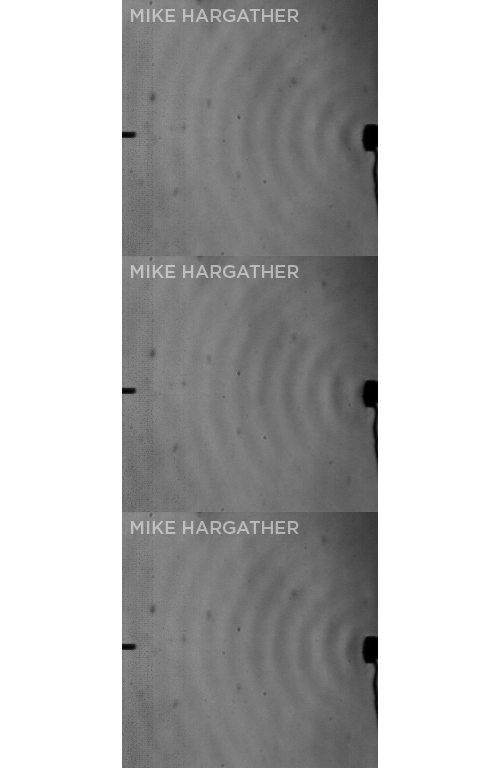
The speaker (on the right in the picture above) emits a sound wave. The areas of high pressure are shown by the darker areas of the picture and the areas of low pressure are shown by the lighter areas of the picture. You can see how the sound wave starts at the speaker and moves out from it. This type of wave is known as a travelling wave as it travels out from the sound source, a bit like waves in the sea.
So sound is simply a wave of areas of high and low pressure travelling through a medium such as air. If we were to now take any point on the above picture, and represent on a graph how the pressure in the air at that point changes over time, we see that our point moves up and down much like a ball would if floated on the sea as the waves pass by. As a point of high pressure passes, the ball moves up, as a point of low pressure passes, the ball moves down.
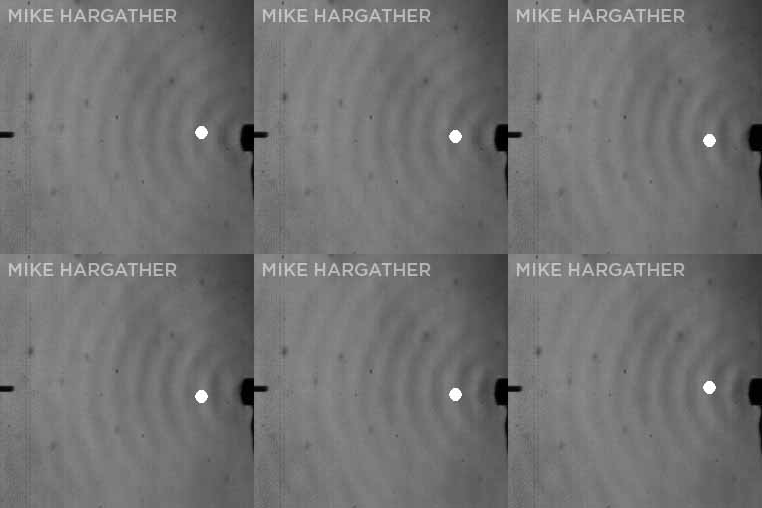
If we now look not only at where that ball is now, but where that ball was a moment ago and a moment before that and so on, we can actually draw a representation of the sound waveform.
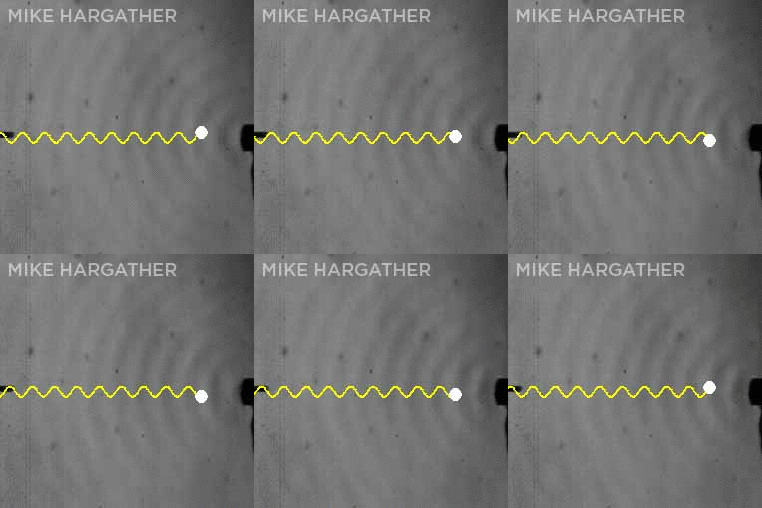
How could we represent this wave as a mathematical formula? It just so happens that there is a mathematical function that looks very much like this simple wave shape. That function is called a Sine function.
You may remember the Sine function from your school days as having something to do with the angles of triangles. If you take the result of the Sine of the angle of a triangle and multiply it by the length of the hypotenuse (the sloped bit of the triangle), it will give you the height of the triangle’s apex. But what has this purely mathematical function got to do with the sound waves we saw before? Well just watch this:
How can something so simple like a Sine wave be so versatile. After all we use sound to transfer information in speech or music. How can such a simple wave like this contain so much information? Well the short answer is that it can’t. This wave just sounds like a single tone.
In the video below we’re going to see and hear what we can do to it to make this Sine Wave sound a little more like a sound you might hear in the real world.
This is the assumption that the Fourier Transform makes about sound. It assumes that sound is made by adding together lots of simple Sine Waves of differing frequencies and differing amplitudes and as all sound is made by some membrane vibrating back and forth, like a violin string, a set of human vocal chords, a speaker cone or a ruler, this assumption is a pretty accurate one.
After looking at what happens when we vary the Frequency and Amplitude of our Sine Wave, in the next post, we are going to look at what happens when we vary the 3rd and final property of our Sine Wave – Phase!
Next Time: The Phase of a Sine Wave >>

